The Weekly COVID Update: The Perils of The Simpsons and Simpson’s Paradox
Imagine the predicament of a Simpsons writer. Picture yourself sitting in a room. Alone. A pad of paper in front of you. Six-hundred and eighty-four episodes of the Simpsons looming behind you. You need something new. Think! Think! You need a new premise, a new character, a new gag. Something that hasn’t been done in the more than 15,000 minutes of run-time your show has in its history. How can you create something new when it’s all been done before?
You can at least take comfort that other writers for other shows share your plight. South Park even made a whole episode to vent about the problem: Simpsons Already Did It.
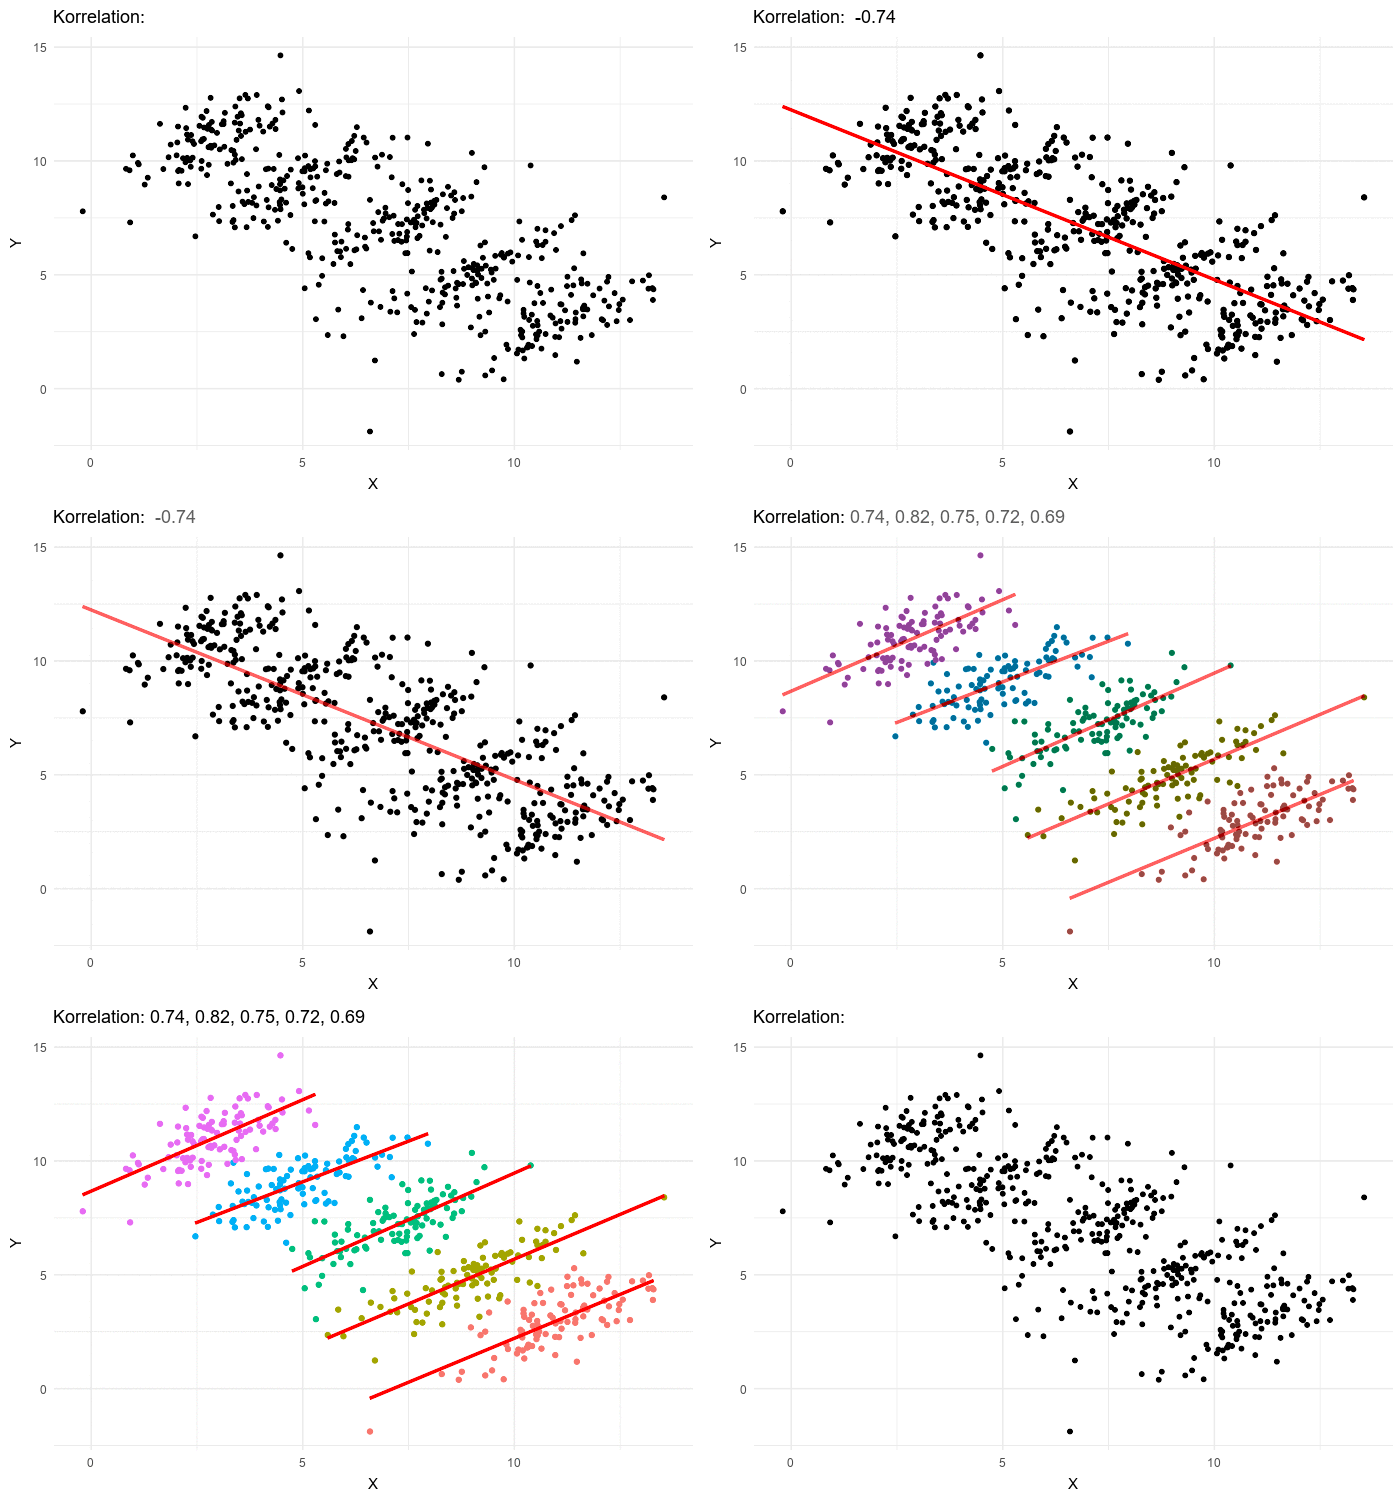
The struggle to create something new can apply to researchers too. How can we draw novel insights from data when thousands of other researchers have are working toward the same task? Simpsons or rather Simpson’s pops up here as well. Simpson’s Paradox occurs when a trend is present in different groups of data, but disappears or reverses when the groups are combined. Illustrated succinctly by Minute Physics. Understanding Simpson’s Paradox is essential for understanding COVID-19.
When Italy was the first European country hard hit by COVID-19, the virus seemed to be much deadlier there than in China. Italians diagnosed with COVID were more likely to die than Chinese patients with the same diagnosis. This statistic might lead us to think that Italians were more susceptible to the virus or that treatments implemented by Italian doctors were less effective. However, a large part of the story is inappropriate aggregation of data. Italians with COVID-19 were more likely to die, because with Italy’s older population a higher proportion of high-risk, elderly people were getting sick. Split by age group, Italians were less likely to die of COVID-19.
Simpson’s Paradox more recently popped up in COVID-19 numbers for the United States. Paradoxically, cases were rising, but hospitalizations and death rates were falling. This time, improper aggregation across regions was the culprit. In aggregate, this looked like COVID-19 was under control. Perhaps treatment was working better or less severe cases were being diagnosed. Instead, the reality was that deaths were declining as New York was starting to recover, but outbreaks were popping up in southern states. People in the southern states were catching COVID-19, but it was so early in the outbreaks that they hadn’t yet begun to die in large numbers.
Aggregating data can get us into all sorts of trouble. My favourite example, is a paper about children solving math problems by Robert Siegler. Earlier research had aggregated children’s performance at math problems, averaging the time spent and accuracy across a set of problems. When the data was aggregated, it seemed all children consistently followed the same strategy of adding numbers. They started with the largest number and then counted up from there: 3 + 6 = 6...7...8...9. Siegler found that by analyzing the data question by question rather than in aggregate; new strategies better fit the data. For example, children might simply remember that 3 + 6 = 9, no addition required. Or they might add up all the numbers 3 + 6 = 1...2...3...4...5...6...7...8...9. Understanding the strategies children were actually using helped both in instruction and curriculum development. This paper also has one of my favourite titles: The perils of averaging data over strategies.
This style of title works great for serious topics:
The Perils of Modern Technology
The Perils of Foreign Intervention
The Perils of Forgetting Your Anniversary
Can effectively dramatize many other topics:
The Perils of Leaving Your Camera On
The Perils of a Toddler with Crayons
The Perils of an Empty Kleenex Box
And is really quite magical when applied to mundane nouns:
The Perils of Peaches
The Perils of Shrubbery
The Perils of Hedgehogs
In summary, be wary of lumping data together. Think carefully about the groups that might underly your data, whether age, region, or problem-solving strategy. By slicing data carefully, you might resolve a paradox of your own.


